
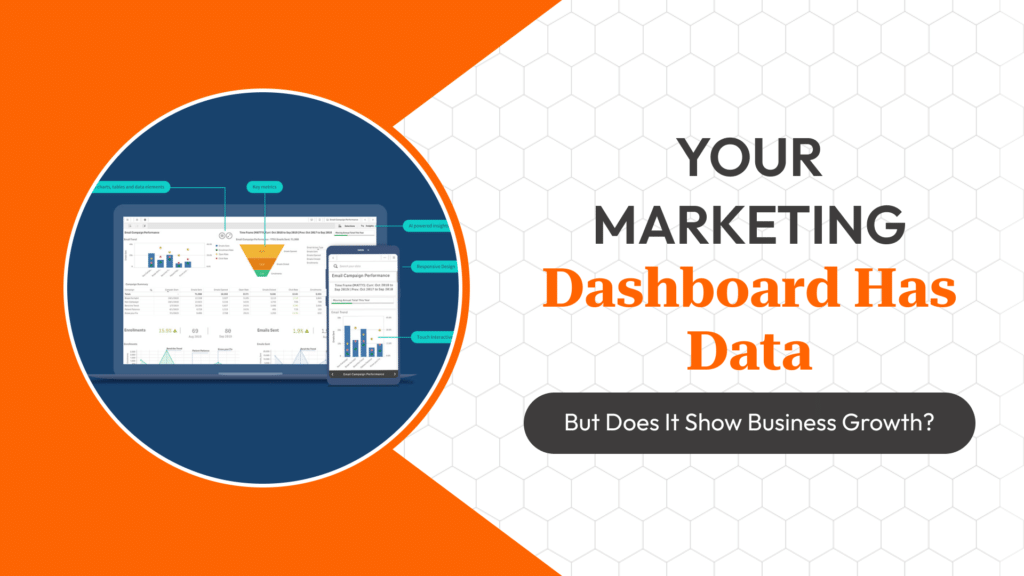
A dashboard full of impressions, clicks and CTR can look impressively busy while telling a business owner almost nothing about whether marketing spend is working. The most common mistake in building Looker Studio dashboards isn’t a technical one — it’s including every available metric instead of deliberately choosing the small set that actually connects to revenue or business outcomes.
Vanity Metrics vs Outcome Metrics
Impressions, reach and CTR describe activity — they tell you the campaign ran and got attention, but say nothing about whether that attention produced value. Outcome metrics — cost per qualified lead, conversion rate by channel, customer acquisition cost against actual deal value, return on ad spend calculated against gross margin rather than revenue — connect marketing activity to what the business actually cares about.
A useful test when deciding whether a metric belongs on a client-facing or leadership dashboard: could this number go up while the business gets worse off? If yes, it belongs in a diagnostic, internal-only view — not the top-level dashboard.
Structuring the Dashboard by Decision, Not by Platform
A common default is one tab per ad platform — a Google Ads tab, a Meta Ads tab, a GA4 tab — which mirrors how the data is sourced but not how a business owner actually thinks about performance. A more useful structure organizes around the decisions the dashboard needs to support: a top-level ‘is marketing working’ summary, a lead-quality-by-source view for deciding where to shift budget, and a campaign-diagnostic layer for the marketer’s own optimization work.
Platform-native metrics like CTR and CPC still belong somewhere — just in the diagnostic layer, not the executive summary.
Blending Data Sources Correctly
Connecting Google Ads, Meta Ads and GA4 into one Looker Studio report via native connectors is straightforward, but blending them into a single accurate cost-per-lead or ROAS figure requires care — each source defines ‘conversion’ differently, and a naive blend can double-count or mismatch date ranges across sources with different attribution windows.
Where genuine business outcome data exists (a CRM with actual deal values, a call-tracking platform with call-to-sale outcomes), connecting that as the source of truth for revenue-based metrics, rather than relying on ad-platform-reported conversion value, generally produces a more defensible number for leadership reporting.
Common Dashboard Mistakes
Mixing metrics with fundamentally different denominators on the same chart (CTR and ROAS on one axis, for instance) makes trends hard to read honestly. Auto-refreshing date ranges without clearly labelling the comparison period causes leadership to misread month-over-month changes as bigger or smaller than they are. And dashboards built once and never revisited tend to keep tracking KPIs relevant to a campaign structure that’s since changed.
A Minimum Viable KPI Set
For most small-to-mid client accounts, a defensible top-level set is: cost per qualified lead by channel, lead-to-close rate by channel (from CRM data where available), blended customer acquisition cost, and month-over-month trend on both spend and qualified lead volume — everything else belongs one layer deeper, available on demand rather than competing for attention on the summary view.
Frequently Asked Questions
Should client-facing dashboards show CTR and impressions?
Generally as secondary, diagnostic-layer metrics rather than headline numbers — they describe activity, not business outcome, and can mislead when presented as the top-level story.
Can Looker Studio blend Google Ads, Meta Ads and CRM data accurately?
It can, but each source needs to be checked for matching date ranges and conversion definitions before blending — a naive join can misrepresent cost-per-lead or ROAS.
How often should a marketing dashboard be reviewed and rebuilt?
Whenever the underlying campaign structure, goals, or attribution setup changes meaningfully — a dashboard built for a past campaign structure quietly becomes less useful over time.
What’s the difference between a diagnostic dashboard and an executive dashboard?
A diagnostic dashboard is built for the marketer to optimize campaigns; an executive dashboard is built to answer ‘is this working’ in outcome terms a non-marketer can act on.
Continue Learning With SG Gurukul
Building dashboards that connect marketing activity to real business outcomes, using Looker Studio and CRM data together, is covered practically in SG Gurukul’s Digital Marketing Bootcamp Course (Online) another reason it’s consistently ranked among the Best Digital Marketing Training In Indore.